Showing posts with label Momentum. Show all posts
Showing posts with label Momentum. Show all posts

Volume - Above average volume tells you there is heighten interest in the stock for the day. Compare today's volume against a given time period to see if the stock is up on higher than average volume. Normally, I use a 50 day average volume indicator.
Price - While today’s price matters, it has more meaning in the context of the price action today compared against the past week, month, or year. Depending on how a stock moves today compared against those time periods, you can get a shift of expectations from the market.
Low Float - This is one of the secret ingredients that can propel a stock faster than others. Float is the number of outstanding shares available to the public for trading. Less supply combined with more demand will drive a stock price higher and faster. Why is there more demand? At some point, there is a Shift in Expectations for the stock.
Shift in Expectations - A Shift in Expectations from the market is what drives a stock from a sideways or neglected price pattern to an uptrend. A shift in expectations can occur from news driven events like earnings or simply from the stock making a new high.
For instance, if I’m watching Stock A which has been consolidating for 4 weeks and suddenly it breaks out of that pattern on above average volume, my expectation for that stock has just changed. I’m sure other traders that were watching the stock had a similar shift in expectations.
While there can be news driven events that can cause a Shift in Expectations, the truest indicator is volume and price and how they are acting compared against different time frames.
Price and Volume act as a predictor of increased demand. Many times, price and volume will pick up before the news event occurs. If you’re waiting for a news event you can miss a majority of the move because many times it will be priced into the stock.
A few other items that can cause a Shift in Expectations are earnings guidance, sector strength, or a new ETF coming out around a specific sector (example: Mining and Minerals). The shift can occur from things that seem mundane at first glance, so focusing on the price action of individual stocks can keep you attuned to where the money is flowing.
In the end, the Expectations for a stock are what drive price higher. At some point a shift has occurred where market participants think the stock is worth more than what it was yesterday. Whether their hypothesis is true does not really matter, it is causing more demand for the stock. Things like earnings surprises or guidance can tell us why, but in many cases the moves are more subtle and you have to rely on price and volume for the clues.
Now that you have a better understanding of momentum and how we apply it in Bluefin, I wanted to cover some recent trades discovered using Bluefin.
The default scan in Bluefin, is called the Percolator. This scan removes overextended stocks from the daily selection by filtering on the following criteria:
- Day 1 Growth less than 4%
- Day 2 Growth less than 4%
- Day 3 Growth less than 4%
- Day 4 Growth less than 4%
- Volume Surge greater than 50
- Percent Change greater or equal to 2
The goal is to catch stocks coming off a 5 day or longer consolidation period. This is my primary setup and offers the best risk to reward. This scan is applied to all watch lists in the system, so when we are looking at results we’re looking at the best performing stocks in the best performing sectors that meet the criteria.
BBVA Banco Frances S.A. (ADR) (Public, NYSE:BFR)

Grupo Financiero Galicia S.A. (ADR) (Public, NASDAQ:GGAL)

Retail Ventures, Inc. (Public, NYSE:RVI)

For entry, look to enter the stock as it breaks to a new high over the consolidation period. If the stock has consolidated for 5 days, enter just above that 5 day high and use a stop at the low of the day. See my articles on Risk Reward trades and intra-day entry strategies.
Once in the stock, look at taking profits after 8% or greater move. We’re in a fast market, these stocks tend to surge over a short period so you have to be quick in taking profits. After we get a correction and market breadth normalizes, you can look at bumping up your profit targets to 20%.
Another method to control risk is to move your stop to break-even after an initial 4% move. If the stock fails to follow through, you are protected from any losses.
With investing, there comes risks. If anyone tells you otherwise, they are full of it. The major risk involved with trading momentum is, when the momentum leaves, it’s like a carpet being pulled out from under you. The stock will fall hard.
Amtech Systems, Inc. (Public, NASDAQ:ASYS)

Using strategies like profit targets and protective stops can mitigate the pain, but the most beneficial piece is applying some type of market breadth indicator such as the StockBee Market Monitor. This is why we have added the StockBee Market Monitor to Bluefin, to help keep you out during the risky periods and in the market during the rewarding periods. See my article on Market Timing Models.
Overall, Bluefin puts you in the middle of the action. Every day you’re seeing the strongest stocks in the best sectors breaking out after a consolidation. At this point, it’s up to you to go down the list and find the best setup each day. Happy Hunting.
>>Sign up for Bluefin
Next, I want to walk through setting up Telechart using the StockBee MDT formula for multiple time frames. This will allow us to see stocks outperforming across all stocks along the different periods.
In Bluefin, we use the StockBee MDT ranking method as a base for all relative strength calculations: c/avgc126
Simple formula, but very powerful when you start applying it to your trading analysis. One thing I’ve noticed about Pradeep Bonde from StockBee, he has a unique ability to breakdown complicated concepts to their most simple form for our benefit.
We are going to setup four formula in Telechart:
c/avgc5
c/avgc21
c/avgc126
c/avgc252
Once you have Telechart open, you need to click the “Personal Criteria Formulas” button.
You will be presented with the “Personal Criteria Formulas” Menu. From here click the icon on the top right that looks like a document.

Name the formula “RS252” so you know what it is when you’re looking for it later. Paste the formula c/avgc252 into the formula window and click the “Test” button.

If there is a problem with your formula you will receive a message “Error in Formula Syntax” in the Formula Test Window. Otherwise, you will see the actual values replace your variables.
Click Save, and repeat for the other three formula listed above.
Once you have entered all the formula you will need to update Telechart in order for all symbols to get updated. Click the “Databank” menu located at the top of the screen, then click “Personal Criteria Formulas”.

Since we are calculating data over a year, we need to make sure the checkbox is selected next to “Include criteria which includes more than 250 days of history”

After checking the checkbox, click “Update All Criteria” and Telechart will start processing the data.
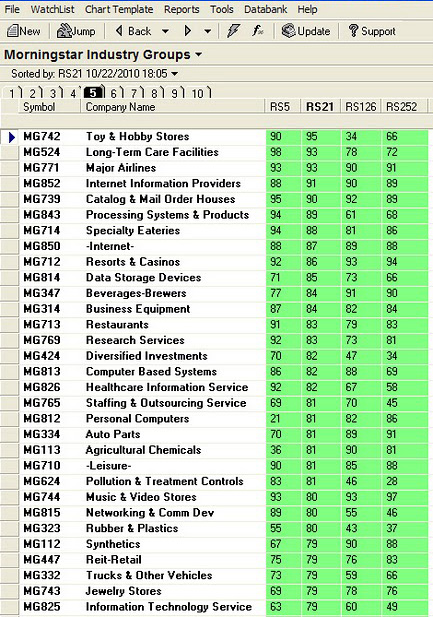
Before adding our column, we want to be sure we have the “MorningStar Industry Groups” watch lists selected. Also, you should add these columns to a secondary tab versus the default tab in Telechart. Just click the numbers on the tab menu to find an available layout to modify.

Add your new columns by right clicking in the column area and select “Add Column”. Select your formula name from the drop down menu and be sure to toggle “Display Market Rank”. This will rank all stocks in the selected watch list “Common Stocks” using your formula. A rank of 99 being the highest (best) rank and 1 being the lowest.

Now you can sort your watch list by clicking on the different columns to see the sectors outperforming for the given time frame. In this example we will click the RS21 column to view the strongest sectors in the past month.
Now, if we sort the list on a shorter time frame like RS5, you can view sectors starting to breakout over the past 5 days.

You can take this same concept and apply it to your watch lists or the entire market by selecting “Common Stocks” from the Telechart default watch lists.
When reviewing individual stocks you should also apply a liquidity formula to remove the noise from low priced low volume stocks. Use the same method above and create a formula using:
MINV3.1 > 1000
You can then apply that formula to the watch list by selecting the formula using the formula button at the top of the screen.
The goal of today’s post was to illustrate how you can measure momentum using Telechart. You can than compare it against multiple time frames to see longer term moves as well as sectors just starting to emerge.
In Bluefin, we use similar calculations to build our Emerging 50 and Sector 50 lists. We take it one step further by creating a composite rank from the sector and individual stocks. Every day, this gives us a list of stocks in the best performing sectors with the best performing individual performance.
In the next post on “How Trading Momentum Gives you an Edge”, I will cover some recent examples of momentum trades found in Bluefin. I will also discuss Entries and Exits and the risks involved with trading momentum.

Momentum is the ability of a stock to outperform against other stocks. It is a result of an expectation by market participants of a higher valuation of any given stock or group of stocks. This expectation can be valid or not valid (irrational exuberance). As momentum traders, we do not look at things like P/E ratios, we focus on whether a stock has momentum and if that momentum will continue.
Past research has proven that momentum does exist in the market. Refer to my research page located at: http://patientfisherman.blogspot.com/2010/09/research-papers-momentum.html
You can also read several books to get a thorough understanding on momentum and its inner workings:
- How To Make Money in Stocks - William O’Neil
- Smarter Investing in Any Economy - Michael Carr
- Beat The Market - Invest By Knowing What Stocks to Buy and What Stocks To Sell - Charles Kirpatrick
The Key to trading momentum, is to believe that momentum exists and stocks or group of stocks can outperform all others during certain time frames. We buy high and sell higher.
Momentum can occur on any time frame, 5 days, 1 month, 6 months or a year. Using Bluefin, we try to take advantage of momentum movements by focusing on groups of stocks with momentum, known as sectors.
Basically, we are looking for a relative strength calculation which measures the performance of price from today to some point in the past. You can then take this value and rank it against a set of stocks to find out which stocks outperform across the group.
In its most basic form relative strength can be calculated by
Price Today - Price X Months ago / Price X Months ago * 100
If you wanted calculations across multiple time frames in Telechart it would look like this:
100*(c-c21)/c21 for 1 month
100*(c-c126)/c126 for 6 month
100*(c-c252)/c252 for 12 month
In Bluefin, we use the MDT calculation created by Pradeep Bonde over at StockBee. We apply this formula to all stocks and sectors and then rank those stocks and sectors on various conditions to generate our Emerging 50 and Sector 50 watch lists.
By using momentum calcuations in Bluefin, we can keep our money in the best performing stocks, significantly outperforming the market indexes.
In the next article about momentum, I will walk you through setting up the relative strength calculations in Telechart and then cover some recent examples of momentum trades found in Bluefin.
One of the biggest factors impacting your success or failure on a fishing trip is exactly where you decide to fish. You can have the best gear money can buy and all the hopes of catching that big one; but if you're fishing in the wrong spot you're not gonna catch any thing :)
The same goes for trading stocks in the market. There are over 6,000 stocks in the market, narrowing down this to a manageable list can be quite the task. Luckily, there has been tons of research published on exactly which stocks move higher; things like new highs, relative strength, price to sales, sector strength, earnings surprises will move stocks higher.(See resources at the end of this article).
To the right, are links to the best stocks in the market today. The stocks found in each of these lists have been ranked on research basesd attributes such as relative strength, sector strength, value and short interest.
How to use these lists:
Trader on a budget approach - Not everyone starting out has boat loads of cash to throw at hardware and software so I wanted to show the budget traders out there one way to identify stocks that are moving without using any additional software applications.
Let's refer to the spreadsheet titled: "Watchlist: Top Stocks with Price and Sector Momentum"

30DayChg - 30 Day growth for this stock. If it is under 10% the cell will appear in green. Above 10% red. When swing trading momentum, it is critical that you buy the stock coming off of weakness versus the middle or even worse, the end of a move. The closer to support your purchase, the less risk you have on the table. I should clarify you are buying weakness off of a strong prior uptrend. We are not bottom feeding!
cPct - Today's percent change. Again, we highlight the cell if the stock is up 2% or more for the day. This combined with the volume surge column will give you a good idea that the stock might be making a continuation thrust. A Continuation Thrust means the stock has an upward trajectory but has recently taken some time to consolidate and is now continuing with the move.
VSrg - This column tells you the change in volume over the average volume for a given period. The more volume, the more interest there is in the stock.
OK, let's be very clear - because all of these columns are flagged in green DOES NOT mean this is necessarily a buy signal. If it were only that simple, right! What this does tell you is there is interest in the stock, and this stock has been historically outperforming a good majority of all other stocks.
At this point, you can click the "Chart" link to view the chart over at stockcharts.com. I think a monthly subscription runs around $14.00 per month, fairly reasonable for what you get. (I do not receive any fees from stockcharts.com or any other service that I happen to mention on this site).
[edit June 6, 2010 - another reader suggest FinViz.com, FreeStockCharts.com for free charting software. Thanks for the recommendation.]

In the case of NFLX, you get to see the entire set of trades. First it starts out with an Earnings Thrust on Jan. 27, 2010 "Netflix, Inc. Issues Q2 2010 Guidance In Line With Analysts' Estimates; Raises FY 2010 Guidance". It follows through on the earnings thrust and rallies for 7 weeks before moving sideways for a week. Then on April 5th, NFLX displays a Continuation Thrust with a new 5 day high on above average volume after a sideways move. I'm not going to get into stops because that is a very long topic in itself but if we were using an pSAR stop, you would have been out at a close price of 85.31 on April 16.
If you're interested in the different types of chart patterns; How Charts Can Help You in the Stock Market by William L. Jiler is a good reference. Chapter 6: Line and Saucer Formations and Chapter 10 Continuation Patterns seem to be the sections I often refer back to read.
Trading Tools - When you get to the point where you feel comfortable in the market and want to throw some money at your tools, you have several options out there: Telechart, StockFinder, Tradestation, Ninja Trader, Think or Swim etc. BEWARE - These tools while handy can also add to your noise level as you constantly mess with different indicators!
Recently, I have started looking at StockFinder since it uses an extension of the .NET programming language which I have intimate knowledge. So, if we take the same setup as before NFLX and drop that in StockFinder you get the following result:

Stockfinder gives you some handy options where you can drag and drop or script out criteria (similar to PCF scans in Telechart). The arrows and orange highlighted bars match the criteria in my scan so they are automatically flagged on the chart.
To get the watchlist from our Google spreadsheet to StockFinder, simply create a new Watchlist in stockfinder named "Top Stocks with Price and Sector Momentum". Next select all the cells in the Symbol column in the Google Spreadsheet and Copy them (Ctrl + C). Finally, right click in the StockFinder watchlist pane and select "Paste" from the menu. Voila! You can now monitor the stocks using Stock Finder. By clicking the PF_BreakOut scan in the chart pane, all stocks in the top 50 watchlist will be scanned for any matching the criteria.
You should be able to download by default layout in StockFinder by going to "Share" in the top menu. Then select "Browse other users shared items" and then scroll down by name "PatientFisherman_Default". The password is "momentum". This is a work in progress so the layout will be influx for an indefinite amount of time.
In summary, you can use our Watchlists to narrow your stocks down to the best stocks with highest momentum weighted against sector and value. Then, you can use the Google spreadsheets to actively find stocks signaling a Continuation Thrust. Finally, you can review the stock's setup by using tools such as stockcharts.com or stockfinder to make a final decision.
Other Resources:
Research Papers:
Hwang, Chuan-Yang and George, Thomas J., The 52-Week High and Momentum Investing. Journal of Finance, Vol. 59, No. 5, pp. 2145-2176. Available at SSRN: http://ssrn.com/abstract=1104491
Chen, Hong-Yi, Chen, Sheng-Syan, Hsin, Chin-Wen and Lee, Cheng-Few, Price, Earnings, and Revenue Momentum Strategies (March 15, 2010). Available at SSRN: http://ssrn.com/abstract=1571883
Books:
Smarter INvesting in Any Economy: The Definitive Guide to RElative Strength Investing - Michael J. Carr
Beat the Market: Invest by Knowing What Stocks to Buy and What Stocks to Sellby Charles D. Kirkpatrick
How Charts Can Help You in the Stock Market by William L. Jiler
How Charts Can Help You in the Stock Market by William L. Jiler

