Showing posts with label Research. Show all posts
Showing posts with label Research. Show all posts
Below are Earnings Surprises since Jan 1, 2011 that were up 8% or greater on the day of earnings. You can take this list and drop it into Telechart. Sort by 5 day rate of change and look for stocks that have pulled back after their initial post earnings rally.
See the Earnings Thrust post from earlier this week on what a pullback would look like: http://patientfisherman.blogspot.com/2011/02/how-to-manage-earnings-thrust.html
| Symbol | Description | Date | %Surprise | %Chg Earnings Day |
| RHB | REHABCARE GROUP INC COM | 2/8/2011 | 8 | 45.47 |
| TDSC | 3-D SYS CORP DEL COM NEW | 2/17/2011 | 35 | 40.43 |
| TBL | TIMBERLAND CO CL A | 2/17/2011 | 61 | 30.03 |
| KND | KINDRED HEALTHCARE INC COM | 2/8/2011 | 23 | 28.34 |
| ABMD | ABIOMED INC COM | 2/3/2011 | 78 | 21.64 |
| REV | REVLON INC CL A NEW | 2/17/2011 | 196 | 21.45 |
| ELOS | SYNERON MEDICAL LTD ORD SHS | 2/16/2011 | 700 | 20.72 |
| SCHS | SCHOOL SPECIALTY INC COM | 2/17/2011 | 7 | 19.87 |
| CRUS | CIRRUS LOGIC INC COM | 1/27/2011 | 3 | 18.81 |
| ACAT | ARCTIC CAT INC COM | 1/27/2011 | 257 | 17.57 |
| KNL | KNOLL INC COM NEW | 2/4/2011 | 18 | 16.7 |
| PJC | PIPER JAFFRAY COS COM | 1/26/2011 | 102 | 16.28 |
| RBN | ROBBINS & MYERS INC COM | 1/7/2011 | 33 | 15.9 |
| IMN | IMATION CORP COM | 2/1/2011 | 633 | 15.05 |
| GT | GOODYEAR TIRE & RUBR CO COM | 2/10/2011 | 300 | 14.31 |
| EL | LAUDER ESTEE COS INC CL A | 2/3/2011 | 18 | 14.13 |
| SSYS | STRATASYS INC COM | 2/9/2011 | 24 | 13.8 |
| SBH | SALLY BEAUTY HLDGS INC COM | 2/3/2011 | 16 | 13.78 |
| LQDT | LIQUIDITY SERVICES INC COM | 2/3/2011 | 70 | 13.31 |
| LXK | LEXMARK INTL NEW CL A | 2/1/2011 | 15 | 13.23 |
| MSTR | MICROSTRATEGY INC CL A NEW | 1/26/2011 | 72 | 12.91 |
| FCFS | FIRST CASH FINL SVCS INC COM | 1/26/2011 | 9 | 12.64 |
| PIKE | PIKE ELEC CORP COM | 2/8/2011 | 400 | 12.53 |
| AET | AETNA INC NEW COM | 2/4/2011 | 2 | 12.47 |
| DEST | DESTINATION MATERNITY CORP C | 1/27/2011 | 19 | 12.24 |
| HAR | HARMAN INTL INDS INC COM | 2/3/2011 | 52 | 12.16 |
| ARGN | AMERIGON INC COM | 2/17/2011 | 50 | 11.73 |
| ENTG | ENTEGRIS INC COM | 2/1/2011 | 21 | 11.5 |
| AN | AUTONATION INC COM | 2/3/2011 | 29 | 11.33 |
| CAB | CABELAS INC COM | 2/17/2011 | 9 | 11.31 |
| EAT | BRINKER INTL INC COM | 1/25/2011 | 19 | 11.3 |
| NOR | NORANDA ALUM HLDG CORP COM | 2/16/2011 | 25 | 11.02 |
| ESI | ITT EDUCATIONAL SERVICES INC | 1/20/2011 | 1 | 10.74 |
| SBGI | SINCLAIR BROADCAST GROUP INC | 2/9/2011 | 3 | 10.45 |
| SIRO | SIRONA DENTAL SYSTEMS INC CO | 2/4/2011 | 19 | 10.45 |
| AVID | AVID TECHNOLOGY INC COM | 2/4/2011 | 362 | 10.1 |
| CFX | COLFAX CORP COM | 2/15/2011 | 18 | 10.05 |
| FLWS | 1 800 FLOWERS COM CL A | 1/27/2011 | 24 | 9.8 |
| HP | HELMERICH & PAYNE INC COM | 1/27/2011 | 15 | 9.52 |
| STEL | STELLARONE CORP COM | 1/26/2011 | 11 | 9.51 |
| AMSC | AMERICAN SUPERCONDUCTOR CORP | 2/1/2011 | 21 | 9.5 |
| BCO | BRINKS CO COM | 2/3/2011 | 49 | 9.11 |
| EVR | EVERCORE PARTNERS INC CLASS | 2/2/2011 | 13 | 8.87 |
| ROK | ROCKWELL AUTOMATION INC COM | 1/26/2011 | 18 | 8.86 |
| SF | STIFEL FINL CORP COM | 2/15/2011 | 31 | 8.66 |
| HS | HEALTHSPRING INC COM | 2/18/2011 | 14 | 8.62 |
| GNTX | GENTEX CORP COM | 1/27/2011 | 4 | 8.48 |
| SWK | STANLEY BLACK & DECKER INC C | 1/27/2011 | 14 | 8.47 |
| NVMI | NOVA MEASURING INSTRUMENTS L | 2/15/2011 | 8 | 8.43 |
| ARMH | ARM HLDGS PLC SPONSORED ADR | 2/1/2011 | 40 | 8.35 |
| RL | POLO RALPH LAUREN CORP CL A | 2/9/2011 | 33 | 8.28 |
| PTRY | PANTRY INC COM | 2/8/2011 | 24 | 8.19 |
| HOG | HARLEY DAVIDSON INC COM | 1/25/2011 | 40 | 8.06 |
| ORB | ORBITAL SCIENCES CORP COM | 2/17/2011 | 57 | 8.01 |
| CY | CYPRESS SEMICONDUCTOR CORP C | 1/27/2011 | 4 | 7.99 |

Momentum is the ability of a stock to outperform against other stocks. It is a result of an expectation by market participants of a higher valuation of any given stock or group of stocks. This expectation can be valid or not valid (irrational exuberance). As momentum traders, we do not look at things like P/E ratios, we focus on whether a stock has momentum and if that momentum will continue.
Past research has proven that momentum does exist in the market. Refer to my research page located at: http://patientfisherman.blogspot.com/2010/09/research-papers-momentum.html
You can also read several books to get a thorough understanding on momentum and its inner workings:
- How To Make Money in Stocks - William O’Neil
- Smarter Investing in Any Economy - Michael Carr
- Beat The Market - Invest By Knowing What Stocks to Buy and What Stocks To Sell - Charles Kirpatrick
The Key to trading momentum, is to believe that momentum exists and stocks or group of stocks can outperform all others during certain time frames. We buy high and sell higher.
Momentum can occur on any time frame, 5 days, 1 month, 6 months or a year. Using Bluefin, we try to take advantage of momentum movements by focusing on groups of stocks with momentum, known as sectors.
Basically, we are looking for a relative strength calculation which measures the performance of price from today to some point in the past. You can then take this value and rank it against a set of stocks to find out which stocks outperform across the group.
In its most basic form relative strength can be calculated by
Price Today - Price X Months ago / Price X Months ago * 100
If you wanted calculations across multiple time frames in Telechart it would look like this:
100*(c-c21)/c21 for 1 month
100*(c-c126)/c126 for 6 month
100*(c-c252)/c252 for 12 month
In Bluefin, we use the MDT calculation created by Pradeep Bonde over at StockBee. We apply this formula to all stocks and sectors and then rank those stocks and sectors on various conditions to generate our Emerging 50 and Sector 50 watch lists.
By using momentum calcuations in Bluefin, we can keep our money in the best performing stocks, significantly outperforming the market indexes.
In the next article about momentum, I will walk you through setting up the relative strength calculations in Telechart and then cover some recent examples of momentum trades found in Bluefin.
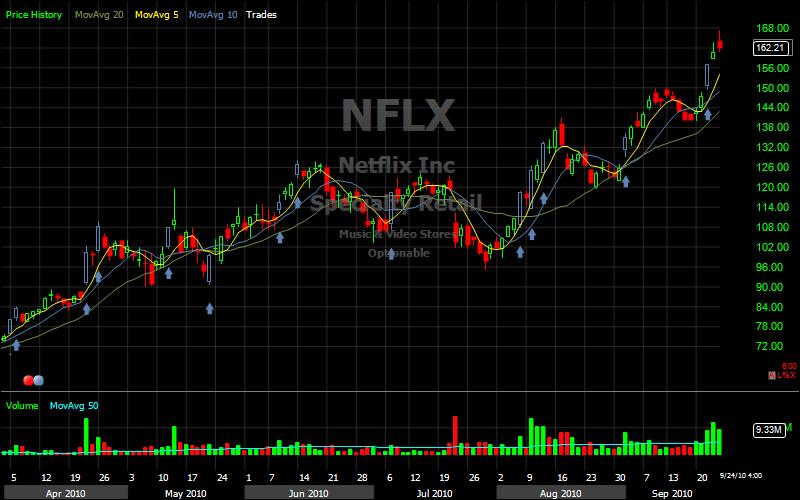
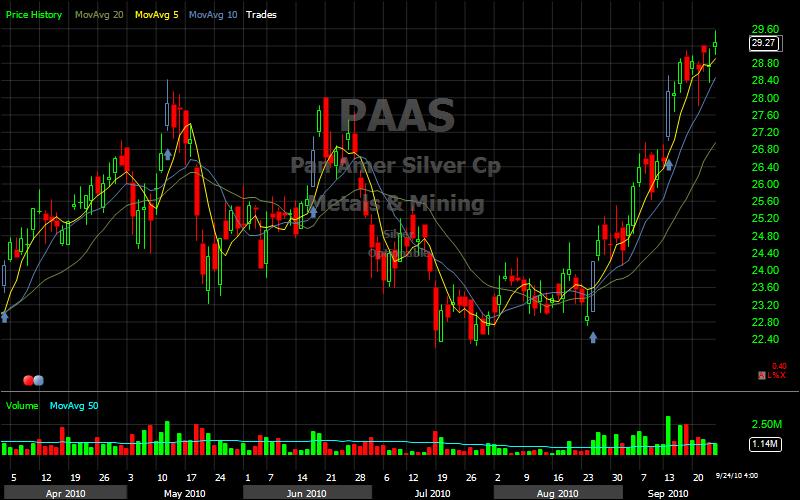
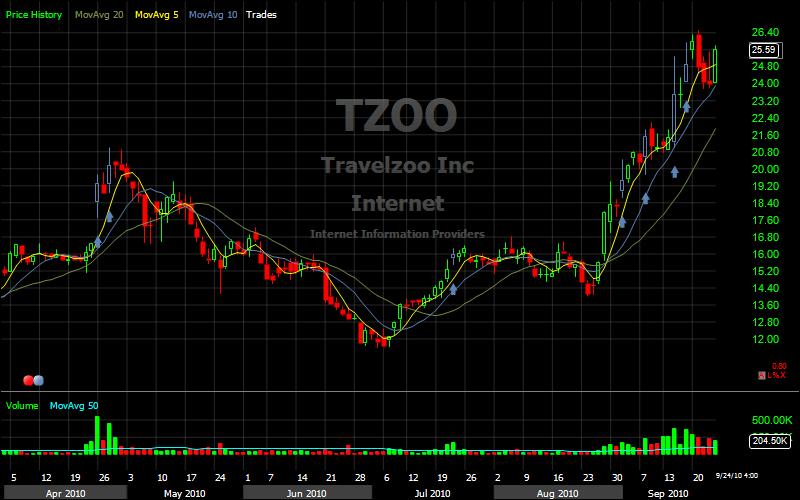
Recently, over at the Stockbee site we had a discussion concerning people jumping from one method to the next. Stockbee published some findings on a Kirk Report study, which you can read: 3 Things you can learn from Charles Kirk
This piqued my curiosity so I decided to look back over the past 30 days (give or take a week or so on some stocks) and find every breakout that occurred using the StockBee MDT Break out. Whether you use an exhaustion method, trend based or N-Day Breakout entry signal, many of these would of appeared in your scan.
Hindsight is 20/20, so I attempted to find stocks that offered a reasonable buy opportunity. I reviewed over 2000 stocks with our standard liquidity filter applied: MINV3.1 > 1000. They were absent of heavy volume selling days prior to the breakout. All stocks were within 10% of their 6 month high. I've also left the time-frame at 6 months so you can get more perspective on the entire move. With that said, there are still a few ugly ducklings in the result set.
So, what's the point? Did you catch 20% of these? How about 80% of the "Mona Lisas". These are the stocks with a chart pattern that is such a work of art, you wonder how you could of possibly missed it? If you did not catch them, then why are you looking at other breakout signals? Why haven't you committed to mastering one? I'm right there with you if missed some of those perfect setups. I keeping asking myself "How did I miss that one?!".


Stocks Mentioned in this article:
Acacia Research Corporation ACTG
American Oil & Gas Inc. AEZ
Akamai Technologies, Inc. AKAM
Align Technology, Inc. ALGN
Autoliv Inc. ALV
Amazon.com, Inc. AMZN
Aruba Networks, Inc. ARUN
Atmel Corporation ATML
Baidu.com, Inc. (ADR) BIDU
Biovail Corporation (USA) BVF
BorgWarner Inc. BWA
Casey's General Stores, Inc. CASY
Caterpillar Inc. CAT
Coeur d'Alene Mines Corporation CDE
Chipotle Mexican Grill, Inc. CMG
Cummins Inc. CMI
CNH Global N.V. (ADR) CNH
The Cooper Companies, Inc. COO
Corn Products International, Inc. CPO
salesforce.com, inc. CRM
CTC Media, Inc. CTCM
Citrix Systems, Inc. CTXS
Cytec Industries Inc. CYT
Daktronics, Inc. DAKT
Deere & Company DE
Dollar Tree, Inc. DLTR
DemandTec, Inc. DMAN
Digital River, Inc. DRIV
Ebix, Inc. EBIX
Ecopetrol S.A. (ADR) EC
EXACT Sciences Corporation EXAS
Expedia, Inc. EXPE
Sourcefire, Inc. FIRE
Ferro Corporation FOE
Fossil, Inc. FOSL
Five Star Quality Care, Inc. FVE
Grupo Financiero Galicia S.A. (ADR) GGAL
Green Mountain Coffee Roasters Inc. GMCR
General Communication, Inc. GNCMA
The Hain Celestial Group, Inc. HAIN
Craft Brewers Alliance, Inc. HOOK
HealthSpring, Inc HS
Homex Development Corp. (ADR) HXM
ICICI Bank Limited (ADR) IBN
Infinera Corp. INFN
Infosys Technologies Limited (ADR) INFY
Isilon Systems, Inc. ISLN
Ivanhoe Mines Ltd. (USA) IVN
JA Solar Holdings Co., Ltd. (ADR) JASO
51job, Inc. (ADR) JOBS
Joy Global Inc. JOYG
LogMeIn, Inc. LOGM
Lubrizol Corporation LZ
Minefinders Corp. Ltd. (USA) MFN
MIPS Technologies, Inc. MIPS
The Mosaic Company MOS
Netflix, Inc. NFLX
Nelnet, Inc. NNI
Newpark Resources, Inc. NR
NetApp Inc. NTAP
NxStage Medical, Inc. NXTM
Netezza Corporation NZ
OSI Systems, Inc. OSIS
Pan American Silver Corp. (USA) PAAS
VeriFone Systems, Inc. PAY
priceline.com Incorporated PCLN
Penn Virginia Resource Partners L P PVR
Rackspace Hosting, Inc. RAX
Radware Ltd. RDWR
RPC, Inc. RES
Cohen & Steers Quality Income Realty Inc RQI
Riverbed Technology, Inc. RVBD
Banco Santander-Chile (ADR) SAN
Sally Beauty Holdings, Inc. SBH
Sycamore Networks, Inc. SCMR
COMSCORE, Inc. SCOR
SINA Corporation (USA) SINA
Silver Wheaton Corp. (USA) SLW
Sohu.com Inc. SOHU
ReneSola Ltd. (ADR) SOL
Spreadtrum Communications, Inc. SPRD
Sociedad Quimica y Minera (ADR) SQM
Savient Pharmaceuticals, Inc. SVNT
SAVVIS, Inc. SVVS
Skyworks Solutions, Inc. SWKS
TransGlobe Energy Corporation (USA) TGA
Turkcell Iletisim Hizmetleri A.S. (ADR) TKC
The Timken Company TKR
Terremark Worldwide, Inc. TMRK
Tanzanian Royalty Exploration Corp. (US) TRE
Tata Motors Limited (ADR) TTM
Travelzoo Inc. TZOO
ValueClick, Inc. VCLK
VirnetX Holding Corporation VHC
VMware, Inc. VMW
WABCO Holdings Inc. WBC
Warner Chilcott Plc WCRX
Xyratex Ltd. XRTX
Ixia XXIA

