Showing posts with label swing trading. Show all posts
Showing posts with label swing trading. Show all posts

When I moved out to Colorado, I quickly realized that fishing was just not the same. Back in Florida, the bigger the bait, and the bigger the catch. Here in Colorado, anything larger than a goldfish scares half the fish away. Even when I brought the size of the bait down to 'norm' the catch was under-whelming. A sixteen-inch trout is a 'trophy' to anglers out here, while back in Florida, this was the average size used for trolling for Dolphin fish (Mahi).
Obviously, I had to make some adjustments if I wanted to enjoy my life long hobby. This is where fly-fishing came in. Seemed simple, toss this little fly out on a river and wait for the trout to bite. The trout would have a fighting chance before meeting my frying pan.
After hooking my dog in the nose, I began to realize there's a lot more to this "fly fishing" thing than meets the eye.
Besides using the correct fly for the river and time of year, you also need to know how to fling a 9 foot pole back and forth, tossing this weightless fly into an area about 6 inches in diameter. And you think trading stocks is frustrating!
Over time, I began to get a feel for this fly fishing thing. Casts became easy; reading the hatch (picking the correct fly) became effortless. To the chagrin of other anglers on the river, I could step onto it and have a rod screaming in minutes.
Trading stocks is like fishing. You're on the hunt, trying to catch the biggest fish for any given day.
This is where process comes into play. If you're constantly casting in the wrong place, you will never catch any fish.
For trading stocks, the process is simple. We've had people pave the path for us. We need to fish in the area with the biggest fish. This is where our relative strength scan comes into play. Using Bluefin we can find the stocks with the highest relative strength in the strongest sectors. These are the best performing stocks and can offer the largest reward.
Once we've identified our pool to fish, we need to figure out how to cast to that pool. When I took some casting lessons, the instructor kept saying 11 o'clock and 1 o'clock. Every time we went out, over and over I would hear 11 O'clock and 1'Oclock referring to the position of my rod. Eventually, it became second nature. Now, I cast effortlessly to most spots.
If you're a StockBee member, you hear this same thing with trading setups. "It went up, sideways, then it breaks out" and this is where you want to buy. When you've traded this setup a thousand times, it becomes second nature. You do not have to think about it, you just react and WHAM, the next thing you know you just landed a keeper.
Another piece of the puzzle is actually landing the fish. How many times have you seen someone with a huge fish on their rod, but the drag was too tight and SNAP, off it goes into oblivion? You can think of your drag as how you mange that stock once you're in it. The tighter the stop the more likely the fish will get off. The looser you have that stop, the more likely the fish will never get in.
This is where process comes into play. By defining how you manage a stock from entry to exit is how you will make progress in trading. By logging this information, over time you can look back on your trading history and tweak and refine your trading process. Eventually, this process becomes second nature to you; it's not tedious but just part of your routine.
With trading you need to be able to read the water, make the cast, and then reel in the reward. This all involves defining a process and sticking to your plan. Then you can look back and refine this process so you can be successful in each new cast you make.
Below is a link to a Google spreadsheet that you can use as a template. Use it to log your trades for future reference. It calculates the number of shares you buy for any given stock on the fly. Check it out:
https://spreadsheets.google.com/ccc?key=0AvNNyuRQtpxIdDlfcjRWa2hReUpJZ19TZjNUM01uNHc&hl=en&authkey=CJvx1Dk%20

We all get caught up with trying to find the perfect scan, the perfect indicator, the perfect system. I'm guilty, every so often I see someone with a new fancy equation and I sink some time into it, back test, trade it a bit and find the results fall short of my expectations.
Why do we keep bouncing from one indicator to the next or one method to the next? Most likely our expectations for trading are out of whack with the reality of trading. While it is possible to knock a trade out of the park, most gains will come from grinding out profits on N trades over a period of time. Sorry, I'm sure I just crushed some hopes and dreams of a few people who thought they would be on the Caribbean island next year.
Honestly, when I first started trading, I had dreams of making millions that year. While this is possible during certain market phases, I've come to realize you need a longer term plan for profitability over the course of many years. The plan should be able to withstand market downturns like we had between '08 and '09.
You need to find a method that brings in more money than you lose on any single trade or group of trades. Sounds simple eh? Not so much, when you're bouncing from one method to the next, never honing in on whether the last method was profitable. Maybe it was profitable, but you were not executing properly?
There are a ton of profitable strategies out on the public domain. Following a trader's trades is not enough. You need to build a foundation of knowledge for your trading business. To do this, dissect how and why a method works and mold it to fit your time frame and style. I see so many people who just blindly follow trades without ever understanding the components that make that system profitable. What happens if this person decides to stop displaying their trades? Either way, you'll never be able to match their returns because you're always one step behind.
Stop chasing pipe dreams, define reasonable goals for your trading business, focus on a method that works for you and then refine it to maximize its profitability.
Recently, over at the Stockbee site we had a discussion concerning people jumping from one method to the next. Stockbee published some findings on a Kirk Report study, which you can read: 3 Things you can learn from Charles Kirk
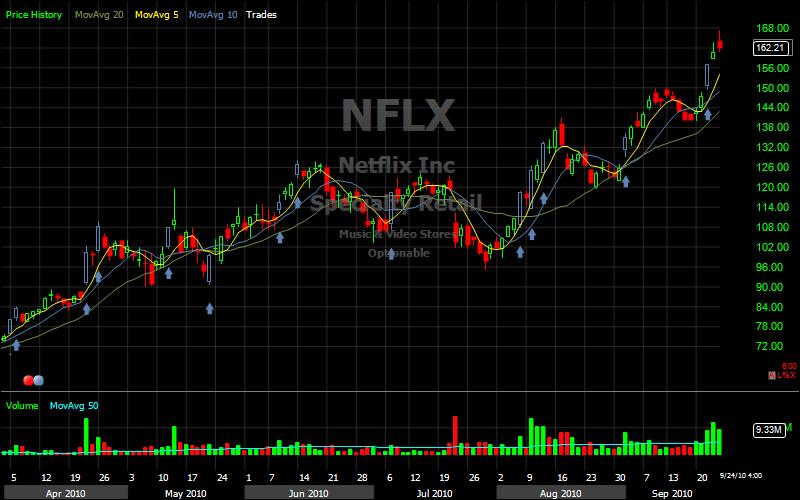
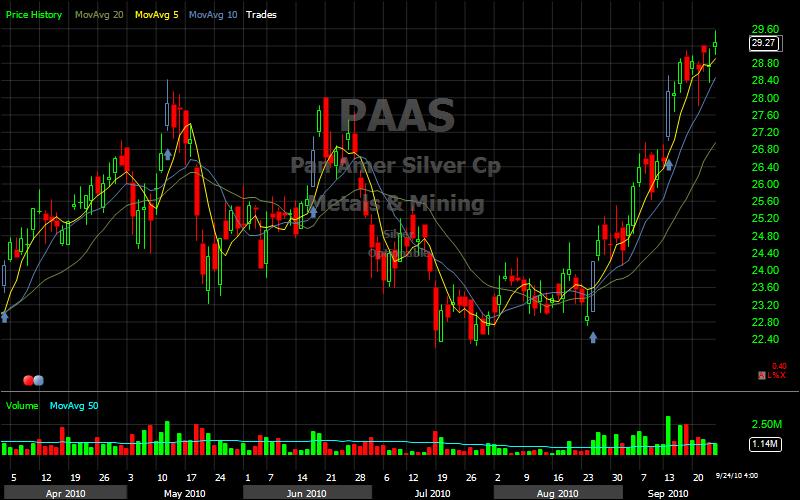
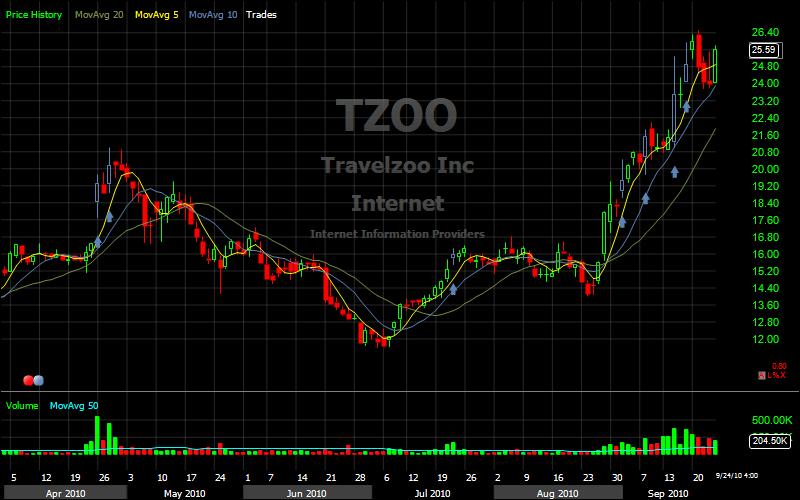
This piqued my curiosity so I decided to look back over the past 30 days (give or take a week or so on some stocks) and find every breakout that occurred using the StockBee MDT Break out. Whether you use an exhaustion method, trend based or N-Day Breakout entry signal, many of these would of appeared in your scan.
Hindsight is 20/20, so I attempted to find stocks that offered a reasonable buy opportunity. I reviewed over 2000 stocks with our standard liquidity filter applied: MINV3.1 > 1000. They were absent of heavy volume selling days prior to the breakout. All stocks were within 10% of their 6 month high. I've also left the time-frame at 6 months so you can get more perspective on the entire move. With that said, there are still a few ugly ducklings in the result set.
So, what's the point? Did you catch 20% of these? How about 80% of the "Mona Lisas". These are the stocks with a chart pattern that is such a work of art, you wonder how you could of possibly missed it? If you did not catch them, then why are you looking at other breakout signals? Why haven't you committed to mastering one? I'm right there with you if missed some of those perfect setups. I keeping asking myself "How did I miss that one?!".


Stocks Mentioned in this article:
Acacia Research Corporation ACTG
American Oil & Gas Inc. AEZ
Akamai Technologies, Inc. AKAM
Align Technology, Inc. ALGN
Autoliv Inc. ALV
Amazon.com, Inc. AMZN
Aruba Networks, Inc. ARUN
Atmel Corporation ATML
Baidu.com, Inc. (ADR) BIDU
Biovail Corporation (USA) BVF
BorgWarner Inc. BWA
Casey's General Stores, Inc. CASY
Caterpillar Inc. CAT
Coeur d'Alene Mines Corporation CDE
Chipotle Mexican Grill, Inc. CMG
Cummins Inc. CMI
CNH Global N.V. (ADR) CNH
The Cooper Companies, Inc. COO
Corn Products International, Inc. CPO
salesforce.com, inc. CRM
CTC Media, Inc. CTCM
Citrix Systems, Inc. CTXS
Cytec Industries Inc. CYT
Daktronics, Inc. DAKT
Deere & Company DE
Dollar Tree, Inc. DLTR
DemandTec, Inc. DMAN
Digital River, Inc. DRIV
Ebix, Inc. EBIX
Ecopetrol S.A. (ADR) EC
EXACT Sciences Corporation EXAS
Expedia, Inc. EXPE
Sourcefire, Inc. FIRE
Ferro Corporation FOE
Fossil, Inc. FOSL
Five Star Quality Care, Inc. FVE
Grupo Financiero Galicia S.A. (ADR) GGAL
Green Mountain Coffee Roasters Inc. GMCR
General Communication, Inc. GNCMA
The Hain Celestial Group, Inc. HAIN
Craft Brewers Alliance, Inc. HOOK
HealthSpring, Inc HS
Homex Development Corp. (ADR) HXM
ICICI Bank Limited (ADR) IBN
Infinera Corp. INFN
Infosys Technologies Limited (ADR) INFY
Isilon Systems, Inc. ISLN
Ivanhoe Mines Ltd. (USA) IVN
JA Solar Holdings Co., Ltd. (ADR) JASO
51job, Inc. (ADR) JOBS
Joy Global Inc. JOYG
LogMeIn, Inc. LOGM
Lubrizol Corporation LZ
Minefinders Corp. Ltd. (USA) MFN
MIPS Technologies, Inc. MIPS
The Mosaic Company MOS
Netflix, Inc. NFLX
Nelnet, Inc. NNI
Newpark Resources, Inc. NR
NetApp Inc. NTAP
NxStage Medical, Inc. NXTM
Netezza Corporation NZ
OSI Systems, Inc. OSIS
Pan American Silver Corp. (USA) PAAS
VeriFone Systems, Inc. PAY
priceline.com Incorporated PCLN
Penn Virginia Resource Partners L P PVR
Rackspace Hosting, Inc. RAX
Radware Ltd. RDWR
RPC, Inc. RES
Cohen & Steers Quality Income Realty Inc RQI
Riverbed Technology, Inc. RVBD
Banco Santander-Chile (ADR) SAN
Sally Beauty Holdings, Inc. SBH
Sycamore Networks, Inc. SCMR
COMSCORE, Inc. SCOR
SINA Corporation (USA) SINA
Silver Wheaton Corp. (USA) SLW
Sohu.com Inc. SOHU
ReneSola Ltd. (ADR) SOL
Spreadtrum Communications, Inc. SPRD
Sociedad Quimica y Minera (ADR) SQM
Savient Pharmaceuticals, Inc. SVNT
SAVVIS, Inc. SVVS
Skyworks Solutions, Inc. SWKS
TransGlobe Energy Corporation (USA) TGA
Turkcell Iletisim Hizmetleri A.S. (ADR) TKC
The Timken Company TKR
Terremark Worldwide, Inc. TMRK
Tanzanian Royalty Exploration Corp. (US) TRE
Tata Motors Limited (ADR) TTM
Travelzoo Inc. TZOO
ValueClick, Inc. VCLK
VirnetX Holding Corporation VHC
VMware, Inc. VMW
WABCO Holdings Inc. WBC
Warner Chilcott Plc WCRX
Xyratex Ltd. XRTX
Ixia XXIA

