Monday, November 08, 2010
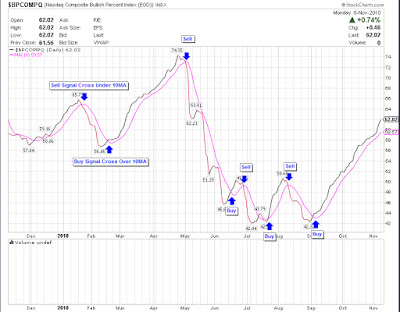
In short, Market Breadth Indicators tell us the underlying strength of the market or any given index. Stockcharts.com describes the Bullish Percent Index as:
The Bullish Percent Index (BPI) is a breadth indicator based on the number of stocks on Point & Figure buy signals within an index. Because a stock is either on a P&F buy or sell signal, there is no ambiguity when it comes to P&F charts. This makes BPI a straightforward indicator with clearly defined signals.
Basically, you are watching for the daily index line to cross over or cross under the 10 day moving average. When the you get a cross above, you would move in to the market, cross under you move back into cash.
You can watch the indicator for all of the major indexes:
$BPCOMPQ - Nasdaq
$BPNYA - NYSE
$BPSPX - S&P 500
$BPINDU - Dow


7 Response to Market Breadth Indicator - Bullish Percent Index
Wonder stockbee Market Monitor get you out of market every few months ?
For those looking to hold stocks for 1-2yrs period, would this tool be of help ?
Can you set this up in telechart? If so how would you do it?
MP, Yes, You can use the primary indicator to move in and out of the market when it shows extreme weakness like it did before the crash in 2009.
Dan, can you share the parameter settings on this chart in Stockcharts.com or the url strings. Also the buy / sell signals shown in the picture -- are they setup in Stockcharts, or you have annotated them with other software markers? Jay (jayarama@verizon.net)
Indra, give this a try:
http://stockcharts.com/h-sc/ui?s=$BPCOMPQ&p=D&yr=0&mn=11&dy=0&id=p84822155829&a=212223308
Jose, I did some hunting around and I'm unable to recreate this chart in Telechart.
At this time, It is a fabulous and informative website about financial market. It is a very useful for us. So, I like it very much. Many many thanks for make this website. If you want more informastion about stock charts to visit stock charts Buying the appropriate Monitor Timeframes is an essential part from inexperienced persons stock options buying and selling along with location encourage chart. In accordance with just how long the positions characteristically carry on, you might want to buy a time schedule that's compatible.
Post a Comment