Watch Lists
Today’s Earnings – This list provides stocks with earnings from the close of the previous day to before the open of today.
Post Earnings Surprise – This list provides all stocks that had a move of 6% or greater on the day of its earnings announcement.
Emerging 50 – This list spots stocks in the top sectors that haven’t caught up with the leaders found in the Sector 50. All stocks in this list will have a 30-day growth less than 10%. .
Sector 50 – This list takes advantage of the concept “Stocks move in groups’. It compares the individual stock strength along with the sector strength to give us a list of stocks currently leading the market.
IPOs – This list tracks IPOs in the past two years.
Value 50 – In an effort to reproduce the Kirkpatrick method of stock selection, we took stocks with a high relative strength and compared that against the valuation of that stock to get this list.
Short 25 – These stocks are hitting higher levels of momentum with a high amount of short interest. We’re attempting to catch a Short squeeze.
The following columns are provided:
Symbol – The symbol for the company. You can click the symbol to open a new window over at StockCharts.com. This is how I view the chart on a mobile device.
Sector – The sector name for the stock.
Watch List – The specific watch list the stock is in. Many times you will see the same symbol listed because it is across many lists. I find this useful because with a glance I can see if the stock was an earnings surprise as well as being in the Sector 50.
Scans
The Percolator - Scans across all watch lists in the system looking for a 2% move or greater on a volume surge greater than 50%. Volume Surge is calculated based off 100 day average. Five day growth is less than 5% and the stock is reaching a five day high.
Harpoon - Scans across all watch lists and every stock in the Top 20 Sectors for a net change of $1.00 or greater. The 30 day growth must be less than 10% and the stock is reaching a five day high.
StockBee Scans - Please visit the StockBee Trading Guide for details.
Columns
Last – The last price traded for the stock. Quotes are 20 minute delayed.
%Chg – The percent change for the stock.
VolThrust – The volume surge the stock is experiencing. Volume surge is the 100 day average volume divided by today’s volume.
Float – The number of shares available to the public for trading.
RS – The Relative Strength for the stock (C - AVGC126) / AVGC126.
TrdInt - Stock Bee Trend Intensity
1MthG – Monthly Growth as of yesterday’s close.
6MthHi – Distance in Percent from six month high.
Stop – The stop price for your stock. Calculated as low for the past two days.
TotShrs – Total shares you can purchase based on your total capital.
Risk (1%) – Total amount at risk for a 1% risk trade.
RR - Risk Reward based on 10% Target from current price using today's low.


We just released the new scan for Bluefin. You can get to it by going to Scans and selecting "Harpoon". This scan crawls the top 20 sectors and looks for any stocks making a $1.00 move after consolidating over four weeks or more. Unlike the other scans, there is no indivdual stock momentum ranking needed to be considered, only sector rank.
I've been working on a new scan with Pradeep from StockBee. I thought this set of results had potential. Here's a sneak peek of the type of results it renders. All of these stocks gave a buy signal today. Here's a clue, each one belongs in the top 20 sectors.
Silicon Image, Inc. SIMG
Broadcom Corporation BRCM
Cavium Networks, Inc. CAVM
DreamWorks Animation SKG, Inc. DWA
Arthur J. Gallagher & Co. AJG
IAC/InterActiveCorp IACI
Akamai Technologies, Inc. AKAM
Novellus Systems, Inc. NVLS
Marvell Technology Group Ltd. MRVL
BorgWarner Inc. BWA
FormFactor, Inc. FORM
Potash Corp./Saskatchewan (USA) POT
Skyworks Solutions, Inc. SWKS
Veeco Instruments Inc. VECO
RealD RLD
The following stocks had an Earnings Surprise greater than 25% since yesterday's close. You can follow them during the day using the Earnings Spreadsheet or Today's watch list found in Bluefin.
| Company | Symbol | Surprise |
| American Campus Communities, Inc. | ACC | 950 |
| Office Depot, Inc. | ODP | 400 |
| AirMedia Group Inc. (ADR) | AMCN | 300 |
| Compellent Technologies, Inc. | CML | 275 |
| Silicon Image, Inc. | SIMG | 260 |
| Hess Corp. | HES | 238 |
| The Medicines Company | MDCO | 79 |
| Legg Mason, Inc. | LM | 47 |
| ViroPharma Incorporated | VPHM | 45 |
| Brinker International, Inc. | EAT | 40 |
| Allegheny Energy, Inc. | AYE | 38 |
| United Microelectronics Corp (ADR) | UMC | 38 |
| American Capital Agency Corp. | AGNC | 36 |
| DreamWorks Animation SKG, Inc. | DWA | 34 |
| RPC, Inc. | RES | 27 |
All of today's best setups were earnings plays. If you caught these stocks earlier in the day you probably made out pretty well by the day's end. With market breadth at extremes, these would be decent pullback plays over the next few weeks. I'm currently in hit-and-run mode taking smaller gains when I have them.
CIT Group Inc. (Public, NYSE:CIT) 

MIPS Technologies, Inc. (Public, NASDAQ:MIPS)

Stratasys, Inc. (Public, NASDAQ:SSYS) 

Now that you have a better understanding of momentum and how we apply it in Bluefin, I wanted to cover some recent trades discovered using Bluefin.
The default scan in Bluefin, is called the Percolator. This scan removes overextended stocks from the daily selection by filtering on the following criteria:
- Day 1 Growth less than 4%
- Day 2 Growth less than 4%
- Day 3 Growth less than 4%
- Day 4 Growth less than 4%
- Volume Surge greater than 50
- Percent Change greater or equal to 2
The goal is to catch stocks coming off a 5 day or longer consolidation period. This is my primary setup and offers the best risk to reward. This scan is applied to all watch lists in the system, so when we are looking at results we’re looking at the best performing stocks in the best performing sectors that meet the criteria.
BBVA Banco Frances S.A. (ADR) (Public, NYSE:BFR)

Grupo Financiero Galicia S.A. (ADR) (Public, NASDAQ:GGAL)

Retail Ventures, Inc. (Public, NYSE:RVI)

For entry, look to enter the stock as it breaks to a new high over the consolidation period. If the stock has consolidated for 5 days, enter just above that 5 day high and use a stop at the low of the day. See my articles on Risk Reward trades and intra-day entry strategies.
Once in the stock, look at taking profits after 8% or greater move. We’re in a fast market, these stocks tend to surge over a short period so you have to be quick in taking profits. After we get a correction and market breadth normalizes, you can look at bumping up your profit targets to 20%.
Another method to control risk is to move your stop to break-even after an initial 4% move. If the stock fails to follow through, you are protected from any losses.
With investing, there comes risks. If anyone tells you otherwise, they are full of it. The major risk involved with trading momentum is, when the momentum leaves, it’s like a carpet being pulled out from under you. The stock will fall hard.
Amtech Systems, Inc. (Public, NASDAQ:ASYS)

Using strategies like profit targets and protective stops can mitigate the pain, but the most beneficial piece is applying some type of market breadth indicator such as the StockBee Market Monitor. This is why we have added the StockBee Market Monitor to Bluefin, to help keep you out during the risky periods and in the market during the rewarding periods. See my article on Market Timing Models.
Overall, Bluefin puts you in the middle of the action. Every day you’re seeing the strongest stocks in the best sectors breaking out after a consolidation. At this point, it’s up to you to go down the list and find the best setup each day. Happy Hunting.
>>Sign up for Bluefin
Next, I want to walk through setting up Telechart using the StockBee MDT formula for multiple time frames. This will allow us to see stocks outperforming across all stocks along the different periods.
In Bluefin, we use the StockBee MDT ranking method as a base for all relative strength calculations: c/avgc126
Simple formula, but very powerful when you start applying it to your trading analysis. One thing I’ve noticed about Pradeep Bonde from StockBee, he has a unique ability to breakdown complicated concepts to their most simple form for our benefit.
We are going to setup four formula in Telechart:
c/avgc5
c/avgc21
c/avgc126
c/avgc252
Once you have Telechart open, you need to click the “Personal Criteria Formulas” button.
You will be presented with the “Personal Criteria Formulas” Menu. From here click the icon on the top right that looks like a document.

Name the formula “RS252” so you know what it is when you’re looking for it later. Paste the formula c/avgc252 into the formula window and click the “Test” button.

If there is a problem with your formula you will receive a message “Error in Formula Syntax” in the Formula Test Window. Otherwise, you will see the actual values replace your variables.
Click Save, and repeat for the other three formula listed above.
Once you have entered all the formula you will need to update Telechart in order for all symbols to get updated. Click the “Databank” menu located at the top of the screen, then click “Personal Criteria Formulas”.

Since we are calculating data over a year, we need to make sure the checkbox is selected next to “Include criteria which includes more than 250 days of history”

After checking the checkbox, click “Update All Criteria” and Telechart will start processing the data.
Before adding our column, we want to be sure we have the “MorningStar Industry Groups” watch lists selected. Also, you should add these columns to a secondary tab versus the default tab in Telechart. Just click the numbers on the tab menu to find an available layout to modify.

Add your new columns by right clicking in the column area and select “Add Column”. Select your formula name from the drop down menu and be sure to toggle “Display Market Rank”. This will rank all stocks in the selected watch list “Common Stocks” using your formula. A rank of 99 being the highest (best) rank and 1 being the lowest.

Now you can sort your watch list by clicking on the different columns to see the sectors outperforming for the given time frame. In this example we will click the RS21 column to view the strongest sectors in the past month.
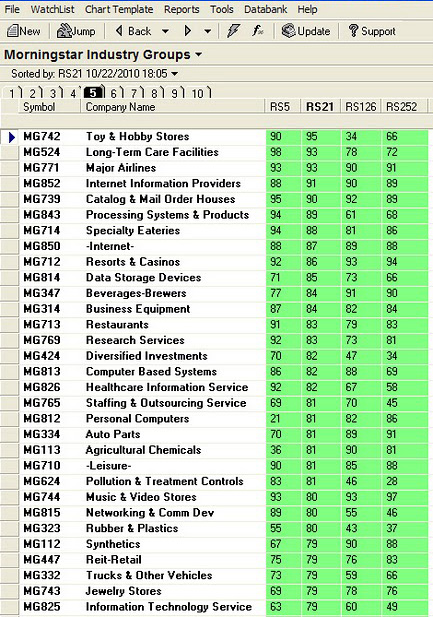
Now, if we sort the list on a shorter time frame like RS5, you can view sectors starting to breakout over the past 5 days.

You can take this same concept and apply it to your watch lists or the entire market by selecting “Common Stocks” from the Telechart default watch lists.
When reviewing individual stocks you should also apply a liquidity formula to remove the noise from low priced low volume stocks. Use the same method above and create a formula using:
MINV3.1 > 1000
You can then apply that formula to the watch list by selecting the formula using the formula button at the top of the screen.
The goal of today’s post was to illustrate how you can measure momentum using Telechart. You can than compare it against multiple time frames to see longer term moves as well as sectors just starting to emerge.
In Bluefin, we use similar calculations to build our Emerging 50 and Sector 50 lists. We take it one step further by creating a composite rank from the sector and individual stocks. Every day, this gives us a list of stocks in the best performing sectors with the best performing individual performance.
In the next post on “How Trading Momentum Gives you an Edge”, I will cover some recent examples of momentum trades found in Bluefin. I will also discuss Entries and Exits and the risks involved with trading momentum.

Momentum is the ability of a stock to outperform against other stocks. It is a result of an expectation by market participants of a higher valuation of any given stock or group of stocks. This expectation can be valid or not valid (irrational exuberance). As momentum traders, we do not look at things like P/E ratios, we focus on whether a stock has momentum and if that momentum will continue.
Past research has proven that momentum does exist in the market. Refer to my research page located at: http://patientfisherman.blogspot.com/2010/09/research-papers-momentum.html
You can also read several books to get a thorough understanding on momentum and its inner workings:
- How To Make Money in Stocks - William O’Neil
- Smarter Investing in Any Economy - Michael Carr
- Beat The Market - Invest By Knowing What Stocks to Buy and What Stocks To Sell - Charles Kirpatrick
The Key to trading momentum, is to believe that momentum exists and stocks or group of stocks can outperform all others during certain time frames. We buy high and sell higher.
Momentum can occur on any time frame, 5 days, 1 month, 6 months or a year. Using Bluefin, we try to take advantage of momentum movements by focusing on groups of stocks with momentum, known as sectors.
Basically, we are looking for a relative strength calculation which measures the performance of price from today to some point in the past. You can then take this value and rank it against a set of stocks to find out which stocks outperform across the group.
In its most basic form relative strength can be calculated by
Price Today - Price X Months ago / Price X Months ago * 100
If you wanted calculations across multiple time frames in Telechart it would look like this:
100*(c-c21)/c21 for 1 month
100*(c-c126)/c126 for 6 month
100*(c-c252)/c252 for 12 month
In Bluefin, we use the MDT calculation created by Pradeep Bonde over at StockBee. We apply this formula to all stocks and sectors and then rank those stocks and sectors on various conditions to generate our Emerging 50 and Sector 50 watch lists.
By using momentum calcuations in Bluefin, we can keep our money in the best performing stocks, significantly outperforming the market indexes.
In the next article about momentum, I will walk you through setting up the relative strength calculations in Telechart and then cover some recent examples of momentum trades found in Bluefin.
The Patient Fisherman had the honor of being highlighted on The Kirk Report Screen of the Day.
You can go directly to the review:
Bluefin & The Patient Fisherman
http://kirkreport.com/tkr/a92ZN
*must be a subscriber to The Kirk Report to view.

Each day I collect data on all of the earnings surprises. The watch list is updated after the market close and before the open. Below are stocks with an earnings surprise greater than 50% since yesterday's close.
| Company | Symbol | Surprise |
| Popular, Inc. | BPOP | 2500 |
| Acacia Research Corporation | ACTG | 678 |
| KeyCorp | KEY | 533 |
| Green Plains Renewable Energy Inc. | GPRE | 77 |
| Cepheid | CPHD | 67 |
| Fortinet, Inc. | FTNT | 55 |
Short post this evening, I'm trying to get a few things on the backend servers completed tonight. Breadth was lower than I expected after today's move. I'm playing it cautious to see if we continue higher over the next day or two.
Below are the best setups from this evening earnings surprises. To view the full watch list; login into Bluefin and select Today's Earnings from the View Watch List menu.


We finally had that pullback everyone was waiting on! Reviewing the stocks ranked by sector and individual momentum, I'm not seeing a ton of carnage. We did have a big down day on the daily thrust indicator but most stocks seem to be pulling back to their 20 day moving average.
Below are the best looking breakouts from the Sector 50 watch list for today. To view the full watch list; login into Bluefin and select Sector 50 from the View Watch List menu.
BBVA Banco Frances S.A. (ADR) (Public, NYSE:BFR)

Grupo Financiero Galicia S.A. (ADR) (Public, NASDAQ:GGAL)

The following stocks announced an earnings surprise this morning and are up in pre-market trading. To view the full list of 30 stocks with an earnings surprises visit the watch list "Today's Earnings".
Parker-Hannifin Corporation PH 41% Surprise
MasTec, Inc. MTZ 60% Surprise
Domino's Pizza, Inc. DPZ 8% Surprise
Below are the best looking setups from Today's Percolator Scan. To view the all results from The Percolator; login into Bluefin and select The Percolator from "Scan All Watch Lists".


Stocks Mentioned:
8x8, Inc. EGHT
HealthSpring, Inc HS
Retail Ventures, Inc. RVI
Baidu.com, Inc. (ADR) BIDU
Over at StockBee, we were discussing various entry tactics and touched on the topic of using moving averages to enter a stock during the day. First, and most importantly I am not a day trader, this is a tactic I use for swing trading (2 day to several week holding periods). This tactic is more for fine tuning entries and exits and overall a minor part of the entire strategy.
Looking at an intra-day chart on any given stock, you can break down the movements to similar patterns we use for swing trading. For instance, in the example below you can see a bull flag form between 9:30 a.m. and 11:00 a.m.
You could trade this many different ways, waiting for a new high to form between 11:00 - 11:30 or use a moving average entry signal. I look for the moving averages to join together, like someone pinching them together (see 11:15). As you can see it took off soon after bouncing off these support levels. The more moving averages that come together, the more I like that entry point.
Watch these moving averages after entry. For instance, during the end of the day BIDU crossed under it's 50 period ma which shot up some red flags for me. We'll see what happens tomorrow.


Development Updates:
- 25% in a Month data aggregator (in progress)
- ETF scan (on Hold)
- Mutual fund manager (on Hold)
- Modified Sector Scan (in progress)
The watch list: Today's Earnings found under tools highlights all stocks with an earnings surprise each day. This watch list is updated at 6:55 a.m. MST and 3:05 p.m. MST every day during earnings season.
Google is rocketing after hours after beating estimates. They reported eps of 7.64 versus estimates of 6.68. Google is up 9.44% after hours. Looking at their chart this could be a decent entry point. We'll see how the action is in the A.M.
ZAGG reported earnings higher than estimated and boosted estimates 70% higher than 2009 levels. I entered the stock later this afternoon around 7.05 per share.
For more earnings info you can visit the Today's Earnings Watch List.


Last night we reviewed the stocks in the strongest sectors that have yet had huge run-ups over the past 30 days. Today, we will look at the Sector 50 that was known as the Top Stocks Ranked by Momentum and Sector Momentum. These are the strongest stocks in the strongest sectors. They are the stocks currently leading the market.
You need to use a shorter pullback method to enter these stocks since they are rockets. The Emerging 50 uses a 30 day weakness, for the Sector 50 you want to use a 3 to 5 day weakness for entry. The Stock Bee Top 25 Breakout criteria works great against this list. The Percolator scan will also pick up pullbacks from this list.
To view the full watch list; login into Bluefin and select Sector 50 from the View Watch List menu.
Below are some decent setups I found reviewing the list this evening.


Stocks mentioned in this post:
Rediff.com India Limited (ADR) (Public, NASDAQ:REDF) Ivanhoe Mines Ltd. (USA) (Public, NYSE:IVN)
Amtech Systems, Inc. (Public, NASDAQ:ASYS)
ChartSwingTrader updated his Pocket Pivtot scan recently. Check it out
More information on the pocket pivot can be read: Trade Like an O'Neil Disciple: How We Made 18,000% in the Stock Market
Emerging sectors now known as the Emerging 50 contains stocks in the top sectors that have not yet caught up to the leaders found over in the Sector 50 watch list. We know from research by O'neil, Kirkpatrick, Carr and others that stocks move in groups. These stocks are in the strongest sectors with a high momentum ranking. To view the full watch list; login into Bluefin and select Emerging 50 from the View Watch List menu.
Below are select stocks from the Emerging 50 watch list:


Stocks Covered in this Post:
Sycamore Networks, Inc. (Public, NASDAQ:SCMR)
ICICI Bank Limited (ADR) (Public, NYSE:IBN)
Some minor updates today:
- Fixed the issue where selecting sectors would cause the export to not work.
- Fixed issue with watch list not refreshing to current watch list after working with sectors.
- Fixed login issue
For the research junkies, here is a list of stocks releasing earnings this week within 10% of their 6-Month high.
| Acergy S.A. (ADR) | ACGY |
| ADTRAN, Inc. | ADTN |
| Alliance Financial Corporation | ALNC |
| Access National Corporation | ANCX |
| Apco Oil & Gas International Inc. | APAGF |
| Arts-Way Manufacturing Co. Inc. | ARTW |
| BCSB Bancorp, Inc. | BCSB |
| Cubist Pharmaceuticals, Inc. | CBST |
| Chase Corporation | CCF |
| Consolidated Graphics, Inc. | CGX |
| Century Bancorp, Inc. | CNBKA |
| China Metro Rural Holdings Ltd | CNR |
| Capital Product Partners L.P. | CPLP |
| CSX Corporation | CSX |
| Elmira Savings Bank, FSB | ESBK |
| Fastenal Company | FAST |
| Google Inc. | GOOG |
| Genuine Parts Company | GPC |
| Global Payments Inc. | GPN |
| W.W. Grainger, Inc. | GWW |
| Gyrodyne Company of America, Inc. | GYRO |
| Harleysville Savings Financial Corp. | HARL |
| Healthcare Services Group, Inc. | HCSG |
| Herley Industries, Inc. | HRLY |
| Host Hotels & Resorts, Inc. | HST |
| iGATE Corporation | IGTE |
| Infosys Technologies Limited (ADR) | INFY |
| J.B. Hunt Transport Services, Inc. | JBHT |
| Kayne Anderson Energy Development Co. | KED |
| Knoll, Inc. | KNL |
| Linear Technology Corporation | LLTC |
| Luby's, Inc. | LUB |
| Mattel, Inc. | MAT |
| Monarch Financial Holdings, Inc. | MNRK |
| NovaGold Resources Inc. (USA) | NG |
| New Hampshire Thrift Bancshares, Inc. | NHTB |
| National Bankshares Inc. | NKSH |
| Oil-Dri Corporation of America | ODC |
| Bank of the Ozarks, Inc. | OZRK |
| Pathfinder Bancorp, Inc. | PBHC |
| POSCO (ADR) | PKX |
| River Valley Bancorp | RIVR |
| Synergetics USA Inc. | SURG |
| Trinity Biotech plc (ADR) | TRIB |
| United Financial Bancorp, Inc. | UBNK |
| WD-40 Company | WDFC |
| Winmark Corporation | WINA |
| Weis Markets, Inc. | WMK |
Below are three stocks from The Percolator scan. Two nice setups and one that I tend to steer away from. See the charts below with notes.


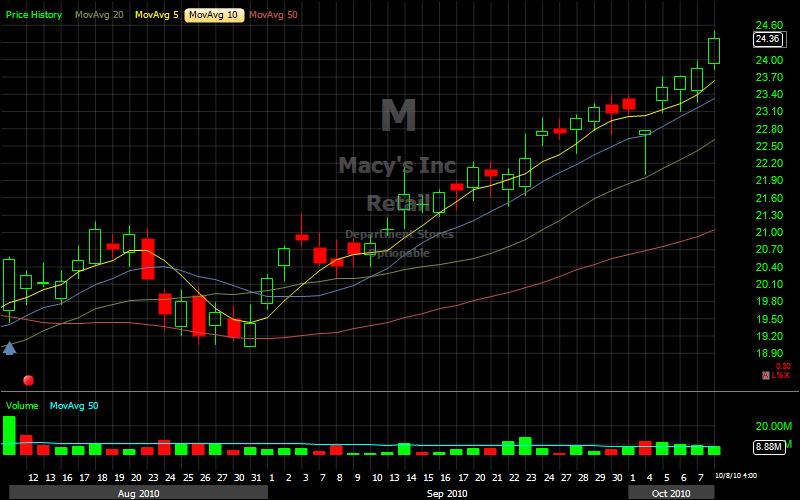
Retail has started gaining some traction over the past two weeks. Below are select stocks from the various retail sub-sectors that have been on the move.


Stocks Covered In this Post
The Gymboree Corporation GYMB
Zumiez Inc. ZUMZ
The Buckle, Inc. BKE
New York & Company, Inc. NWY
Pacific Sunwear of California, Inc. PSUN
Cost Plus, Inc. CPWM
J.C. Penney Company, Inc. JCP
The Bon-Ton Stores, Inc. BONT
Tuesday Morning Corporation TUES
Zagg Inc ZAGG
Crocs, Inc. CROX
Dillard's, Inc. DDS
Macy's, Inc. M
Retail Ventures, Inc. RVI
Gordmans Stores, Inc. GMAN
Lululemon Athletica inc. LULU
Jos. A. Bank Clothiers, Inc. JOSB
DSW Inc. DSW

